Click here if you missed the previous parts of this article: part I, part II
Usefulness and application of these analyses
Who may be interested in this information?
The daily cycle analysis can be very useful to the Building Facility Manager (FM). Every day in the morning, the FM can find out whether the HVAC thermal energy consumption of the previous day was in line with what was expected, i.e. whether it was consistent with the previous day’s hot or cold weather. Otherwise, if the point representing the previous day’s values deviates from an acceptance interval around the regression line, the FM can receive a warning on his mobile phone, and he will connect to a monitoring portal, where he can view the graph in detail, consult the monitored historical databases, and log into the building’s BMS to see if it is a false alarm. If it is not a false alarm, this warning may predict a more serious fault, and it can be advisable to issue a Predictive Maintenance order to inspect what has happened.
This is precisely what the combined tool i-PREDICT + IMAN, developed within the framework of the SPHERE Project, deals with.
The annual cycle analysis is also of great interest, and finds its justification in the EPC contracts that ESCOs sign with energy consumers in buildings. Its difficulty lies in the fact that, in order to deduce the regression line, it requires a longer period of time, not forgetting that in this case, each year contributes one point (one for heating and one for cooling). And we must not forget that the rest of the variables that we have assumed as constants must persist so for several years…
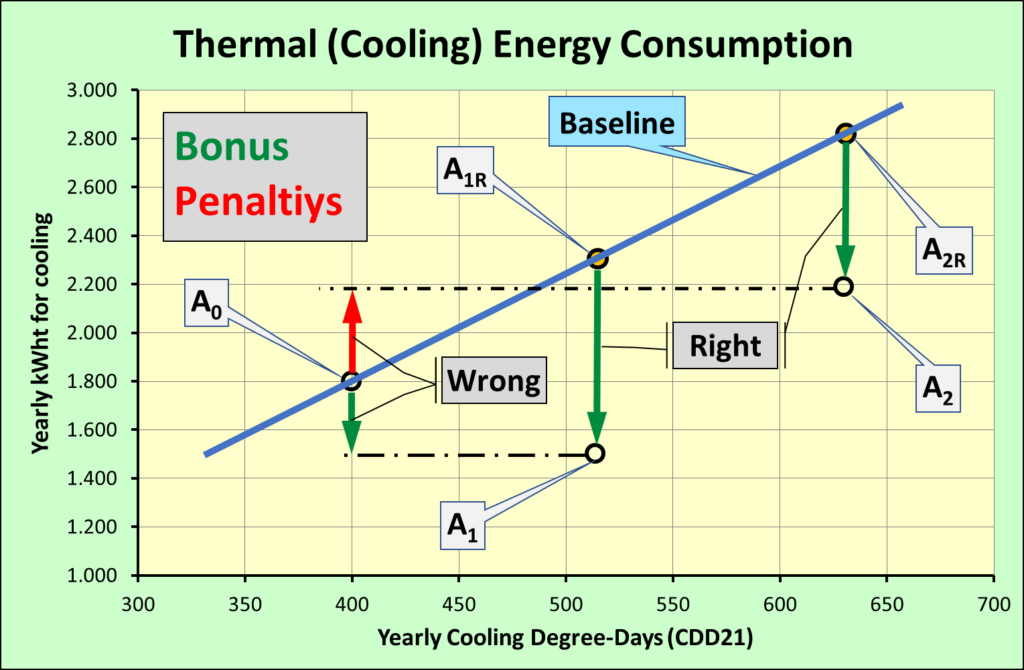
Let us now take a real case as an example. We start from an existing regression line of thermal energy consumption vs Degree-Days previously stated in a building. On the graph, we note the dots that reports the annual consumption of thermal energy applied to cooling for three years. In this real case, the starting situation of the year zero is represented by the dot A0. The Facility Manager of that building proposed a set of actions to improve the rational use of energy. After summer, various energy improvement measures (CMEs) were approved: Adjusting the operating hours, setting a better control of the setpoint temperatures, installing revolving doors, etc.
The situation of the year after is reflected in point A1, which clearly shows a reduction in energy consumption, despite the fact that it was a hotter summer (more CDD). The FM responsible for making the proposal was congratulated by the client. The following year, represented by A2, consumption rebounded compared not only to the previous year, but even to when no measures had been implemented, but it should be noted that this summer was even hotter than the two previous ones. This happened despite the fact that more energy saving measures were implemented after the summer of the first year and before year 2. And congratulation turned to disenchantment, to say the least.
Solution to this problem: One has to know how to read. Not only the words. One also has to know how to read the graphs. This graph tells us that in Year 1, consumption should have been A1R (A1 value regularised on the regression line) so that the congratulations, which in an incorrect reading were A0-A1R, should have been, with the glasses of knowing how to read properly on, A1R-A1, i.e. more than twice. And that on reaching year 2, instead of reprimand or simple disenchantment, there should have been more effusive congratulations, if possible, because the AR2 value regularised on the regression line is such that A2R-A2 > A1R-A1. This simple but true story can make us understand in an easy and didactic way what the basis of pricing the EPC[5] contracts is.
We replace congratulations with money, and the more you save (quantifying with comparable, regularised values), the sooner you will recover the investment that you as an ESCO had to make when agreeing with the client. The regulation of EPC contracts goes far beyond this simple brushstroke, and could be the subject of another interesting article, but we have considered it important to reflect here the importance that the analysis of correlation between Energy Consumption and Degree-Days, applied to air conditioning systems, constitutes a highly effective tool for the management of energy in the operation of buildings.
Moral: Recognise the power that these analyses bring to the energy management of buildings. Not always, but often, clients need to be taught how to read.
References
5. Energy Performance Contracting (EPC) is a mechanism for organising the energy efficiency financing. The EPC involves an Energy Service Company (ESCO) which provides various services, such as finances and guaranteed energy savings. The remuneration of the ESCO depends on the achievement of the guaranteed savings.
Written by Antoni Quintana, from COMSA